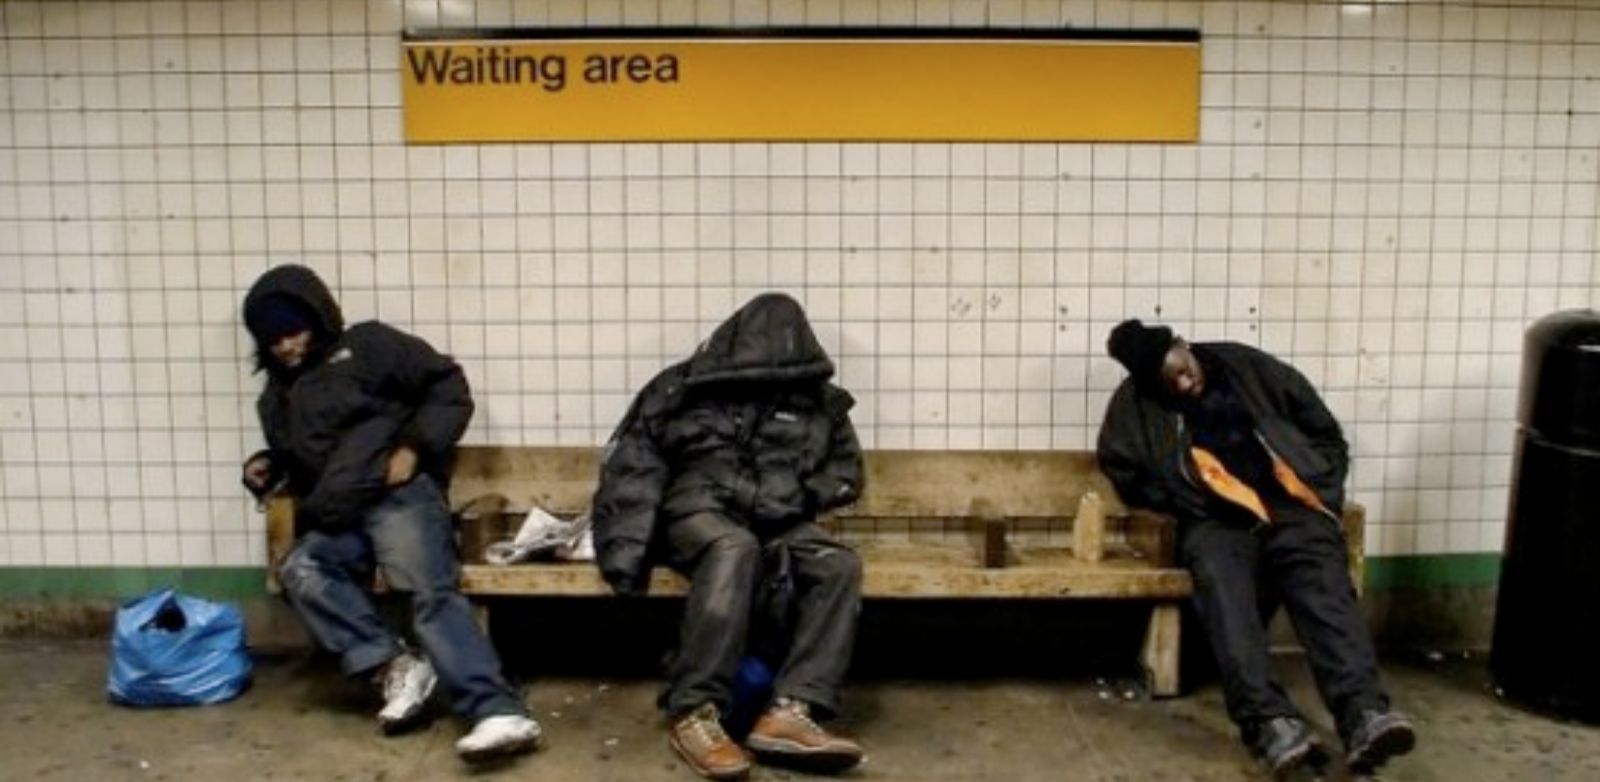


POVERTY FACTS
The Population of Poverty USA
In 2016, 40.6 million people lived in Poverty USA. That means the poverty rate for 2016 was 12.7%.
Who lives in Poverty USA?
All those who make less than the Federal government’s official poverty threshold... which for a family of four is about $24,000.00. People working at minimum wage, even holding down several jobs. Seniors living on fixed incomes. Wage earners suddenly out of work. Millions of families everywhere from our cities to rural communities.
Poverty does not strike all demographics equally. For example, in 2016, 13.8% of men, and 16.3% of women lived in Poverty USA. Along the same lines, the poverty rate for married couples in 2016 was only 5.1% - but the poverty rate for single-parent families with no wife present was 13.1%, and for single-parent families with no husband present was 26.6%.
In 2016, the poverty rate for people living with a disability was 21.0%. That’s more than 4 million people living with a disability—in poverty.
POVERTY BY AGE
Children in Poverty
In 2016, 21.2% of all children (15.3 million kids) lived in Poverty USA—that’s almost 1 in every 5 children.
In 2014, the National Center on Family Homelessness analyzed state-level data and found that nationwide, 2.5 million children experience homelessness in a year.
Seniors in Poverty
Though the official census data gives seniors a 2016 poverty rate of only 9.3%, the Supplemental Poverty Measure, which accounts for expenses such as the rising costs of health care, raises the senior poverty rate to 14.5%.
Poverty by Ethnicity
According to 2016 US Census Data, the highest poverty rate by race is found among Native Americans (27.6%), with Blacks (26.2%) having the second highest poverty rate, and Hispanics (of any race) having the third highest poverty rate (23.4%). Whites had a poverty rate of 12.4%, while Asians had a poverty rate at 12.3%.
The Economics of Poverty
Poverty thresholds are determined by the US government, and vary according to the size of a family, and the ages of its members. In 2016, the poverty threshold—also known as the poverty line—for an individual was $12,228. For two people, the weighted average threshold was $15,569.
Poverty Thresholds
Three people
$19,105
Four people
$24,563
Five people
$29,111
Six people
$32,928
Seven people
$37,458
Eight people
$41,781
Nine or more people
$49,721
For more details about poverty thresholds, visit the US Census Bureau. Poverty thresholds are intended for use as a statistical yardstick, not a complete description of what people and/or families actually need to live.
What’s worse, 6.7% of the population—or 21.3 million people—live in deep poverty, with incomes below 50% of their poverty thresholds.
And 29.8% of the population—or 95 million—live close to poverty, with incomes less than two times that of their poverty thresholds. To learn more about poverty thresholds and what it is like to live at the poverty line, take a look at the statistics.
Sources: How the US Census Measures Poverty, US Census Bureau; Income, Poverty, and Health Insurance Coverage in the United States: 2016, US Census Bureau (p. 17).
Employment
According to the most recent Census data, median household incomes have increased by 3.2% since 2015. This is only the second annual increase in median household income since 2007. In 2016, the median income for family households was $75,062, while the median income for nonfamily households was $35,761.
In 2016, an estimated 74.8% of men with earnings and 62.2% of women with earnings worked full time, year-round. However, in 2016, the earnings of women who worked full time, year-round were only 80.5% of that for men working full time, year-round.
Source: US Census Bureau; Income and Poverty in the United States: 2016
Food Insecurity
The USDA estimated that 12.3% of US households were food insecure in 2016. This means that approximately 15.6 million households had difficulty providing enough food for all their members due to a lack of resources. Rates of food insecurity were substantially higher than the national average for households with incomes near or below the Federal poverty line.
There are programs that help.
61% of food-insecure households in the USDA survey reported that in the previous month, they had participated in one or more of the three largest Federal food and nutrition assistance programs. One of these programs is known as SNAP, or the Supplemental Nutrition Program. Learn more about policies that help.
Source: United States Department of Agriculture, Food Security Status of US Households in 2016
In addition, every day, thousands of people—working with their neighbors and community—are finding ways out of Poverty USA by strengthening families, creating jobs, and improving neighborhoods. For nearly five decades, CCHD has supported nearly 11,000 community-based projects led by low-income people through our grant program. Read some of their stories.